01
4 housing strategies compared
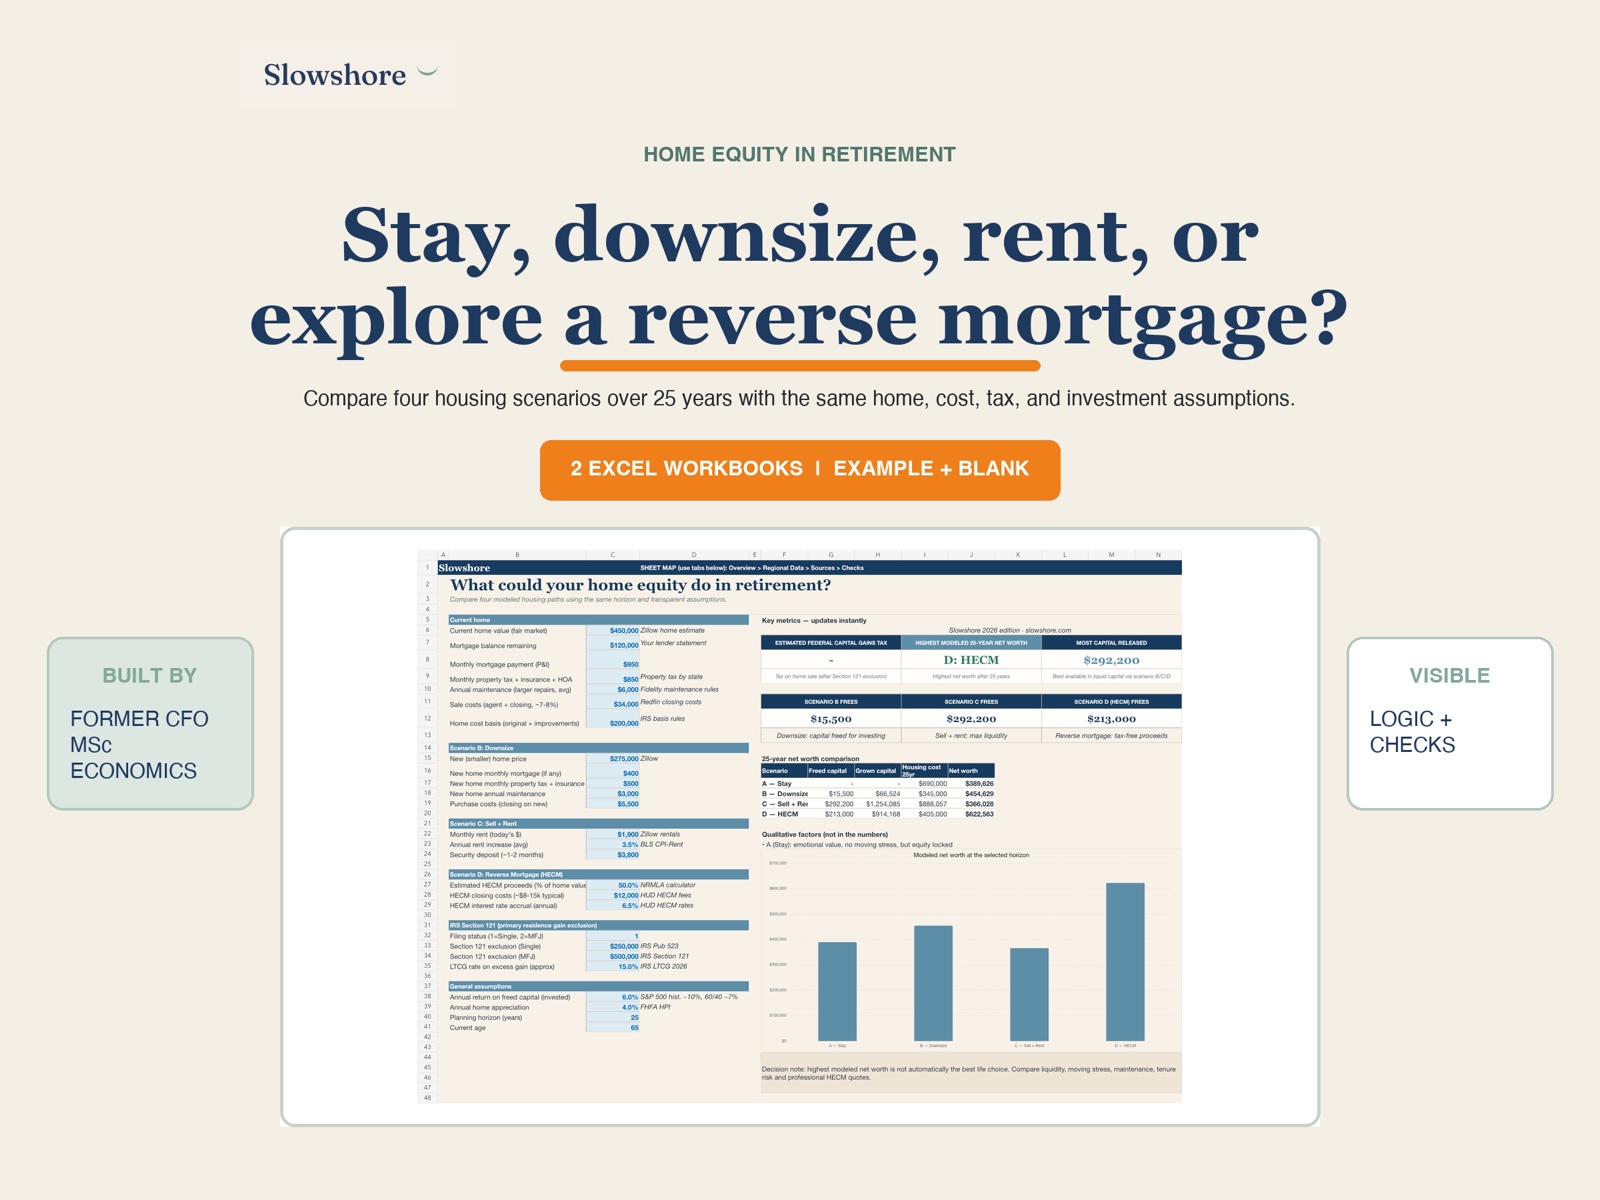
Age in place, downsize to a smaller home, sell and rent, or explore a reverse mortgage.
Home Equity in Retirement 2026
Your home is likely your largest asset. Compare 4 scenarios and see the effect over 25 years, after housing costs and simplified tax assumptions.
$9 · One-time purchase
 1 / 8
1 / 8 What you get
Age in place, downsize to a smaller home, sell and rent, or explore a reverse mortgage.
Reverse mortgage math, $250K/$500K capital gains exclusion, senior property tax freezes where applicable.
See the lifetime wealth difference per strategy.
Detail
Comparison
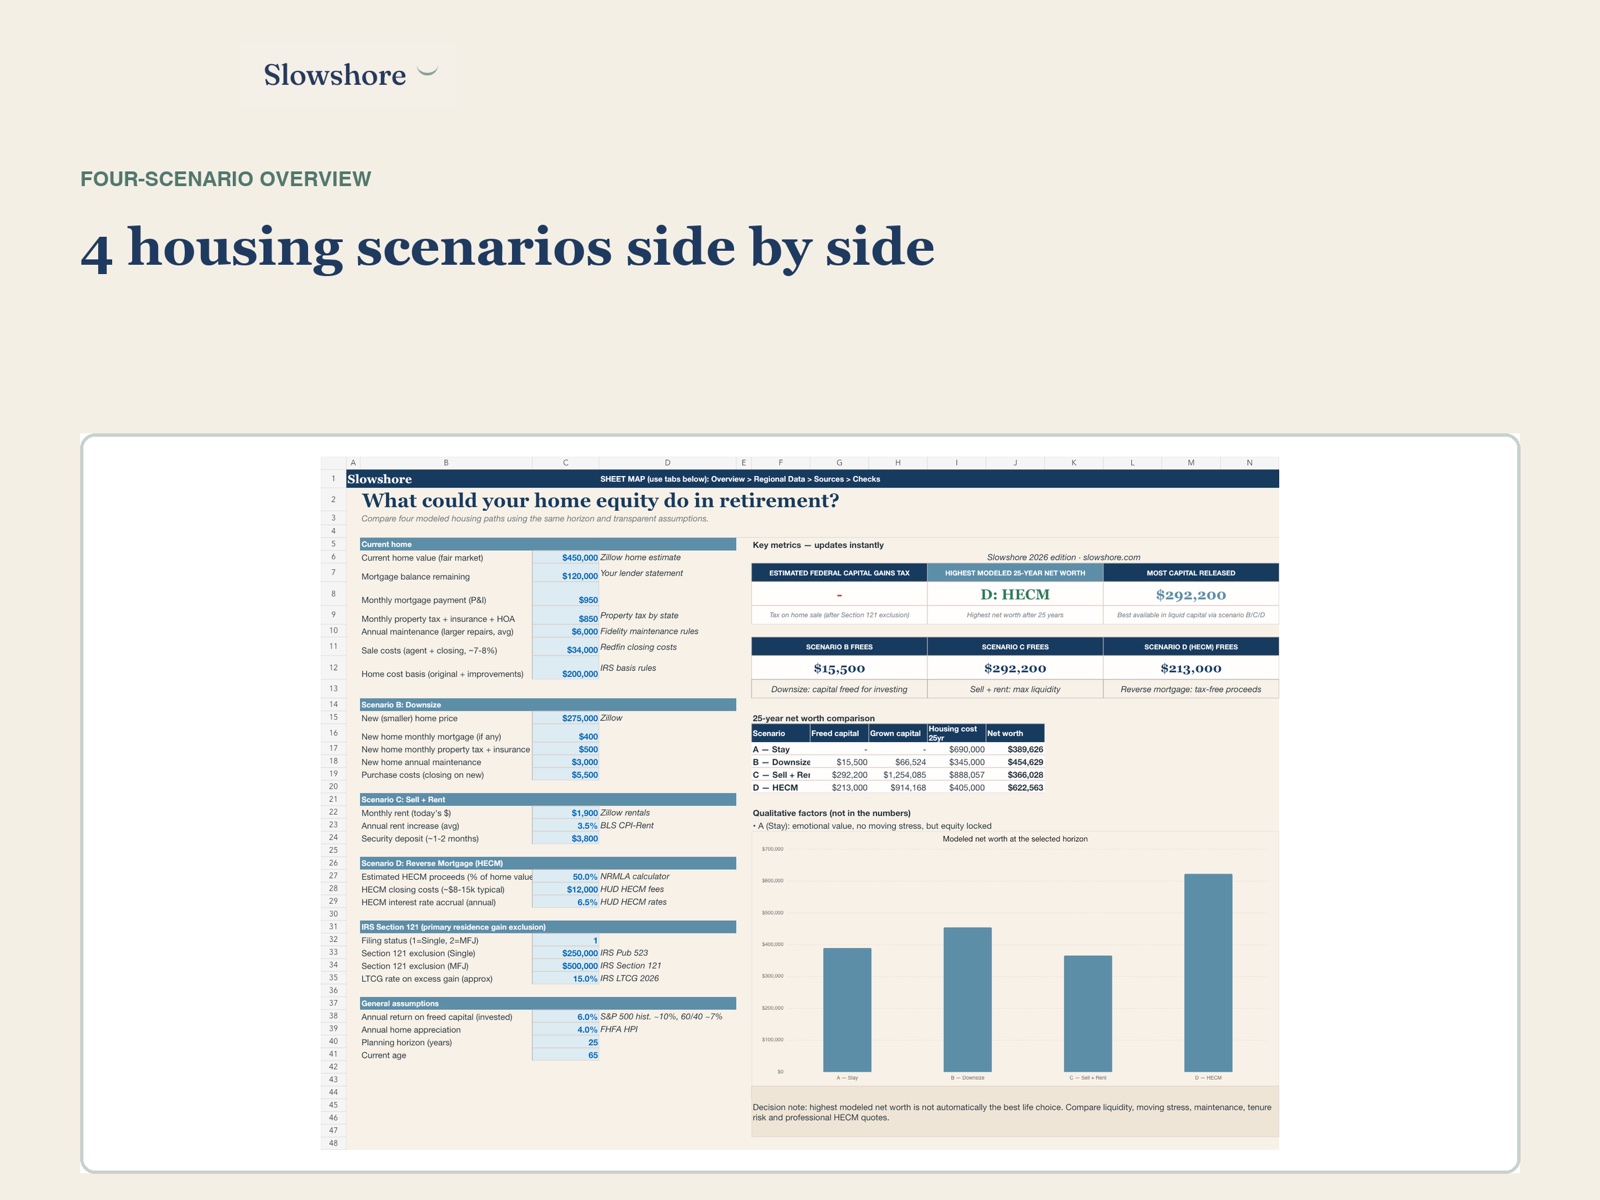
Four strategies are compared under the same assumptions, with ending net worth shown after 25 years.
Capital release
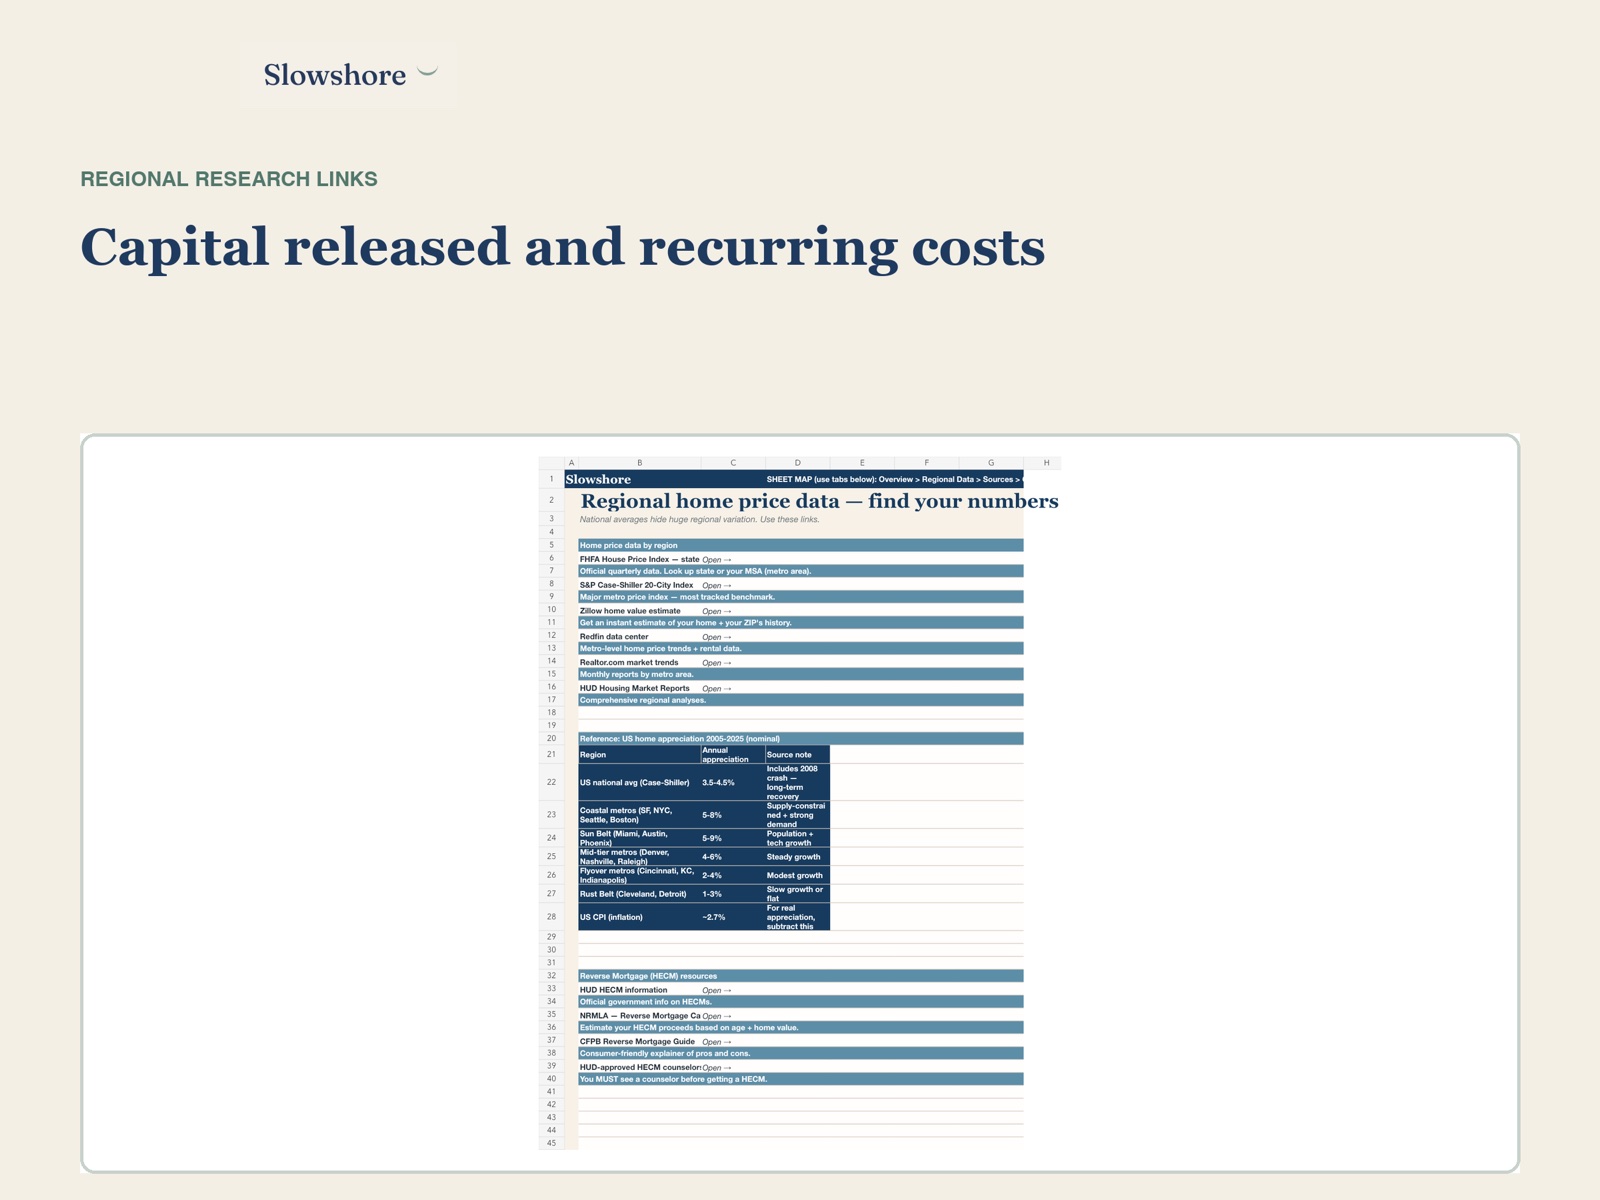
Sale price, mortgage payoff, closing costs, tax: you see exactly what becomes investable.
Carrying costs
Every recurring cost laid out per strategy so hidden costs do not flip the outcome after the fact.
Trust and method
Created by Christian Elkrog, an economist and tech founder with more than a decade of experience and a successful company exit.
Inputs, assumptions, formulas, sources, and limitations are visible so you can understand each result.
No account connection or hidden data collection. Slowshore never receives the information you enter.
Sources
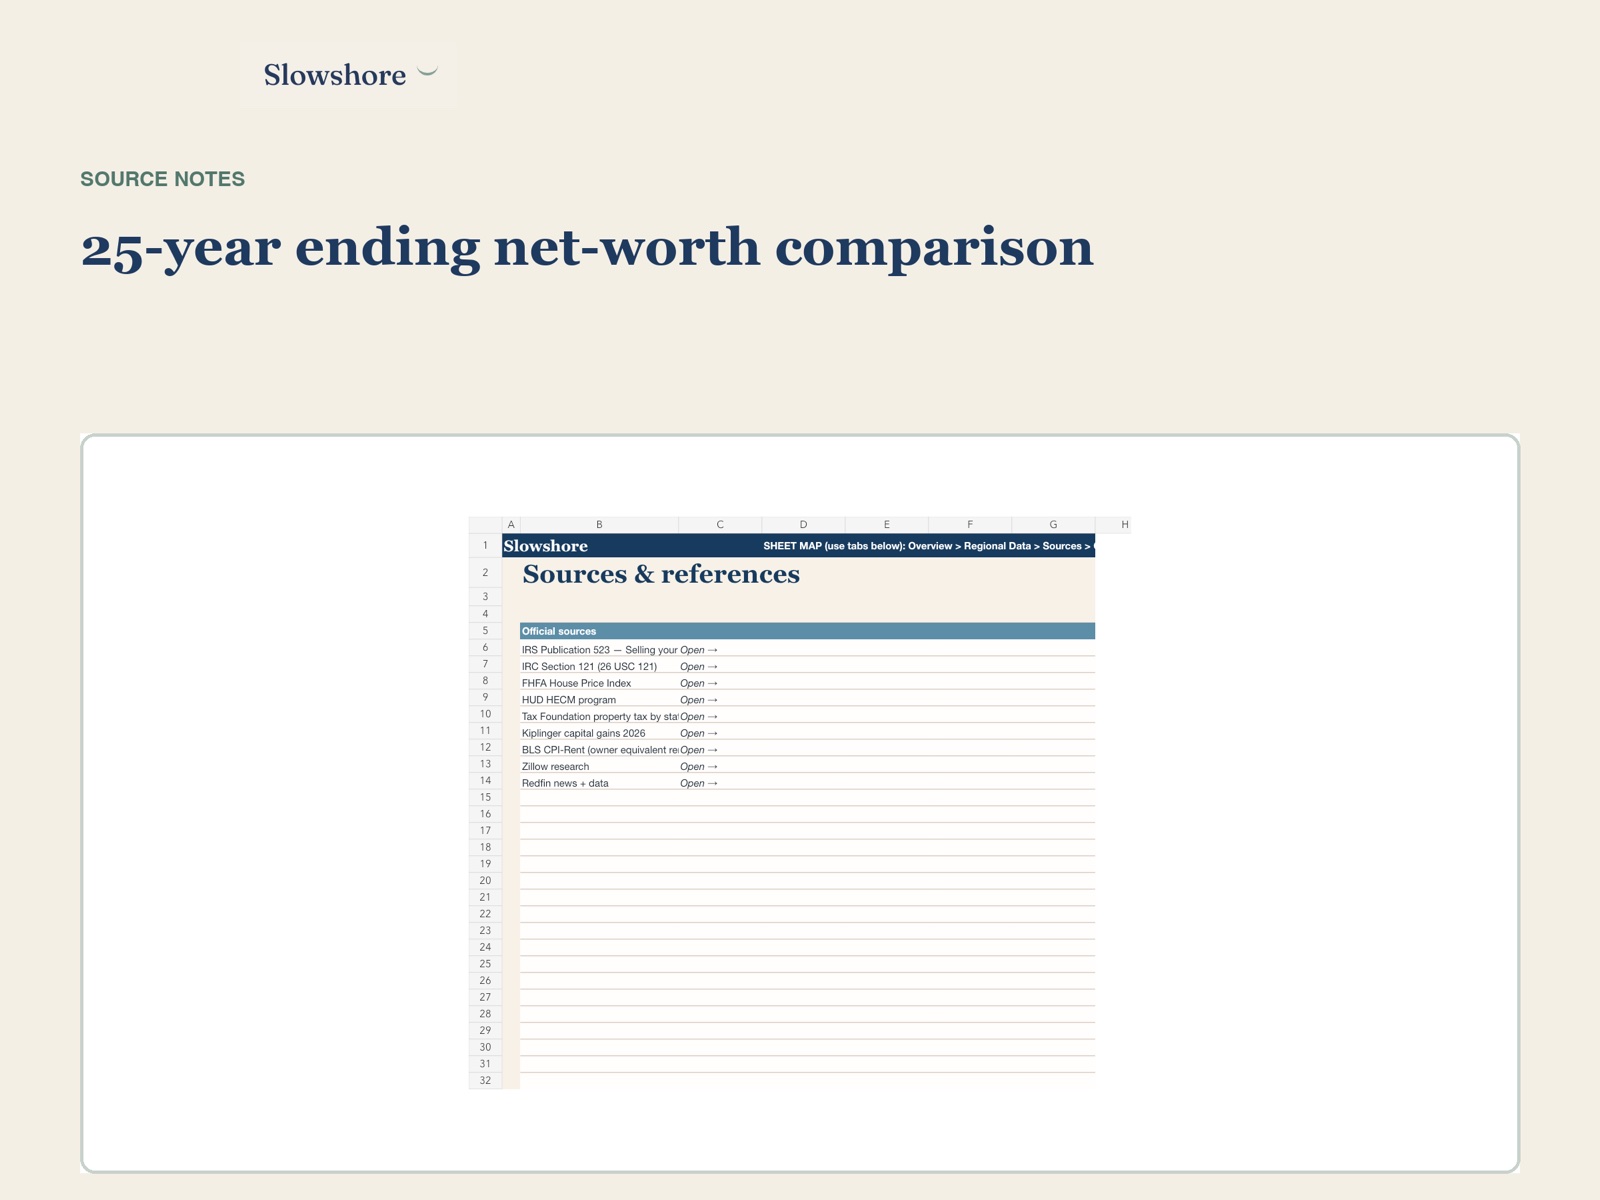
IRS for Section 121 rules and HUD for HECM guidance. Sources and editable assumptions are linked directly in the spreadsheet.
Pricing
Start with this workbook for $9, or get all 8 for $59. One-time purchase with no subscription.
Looking for the browser version? Join the waitlist.
FAQ
No, you fill in marked cells and everything calculates automatically.
See the full list on the product page before buying. The basics: age, retirement account balances, expected spending.
Yes, plus Google Sheets. We send both versions after purchase.
The Excel version stays on your own computer. We never see your numbers.
No. It is a planning tool. Always consult a licensed advisor before major decisions.
14-day money-back guarantee, no questions asked.