01
All claiming scenarios
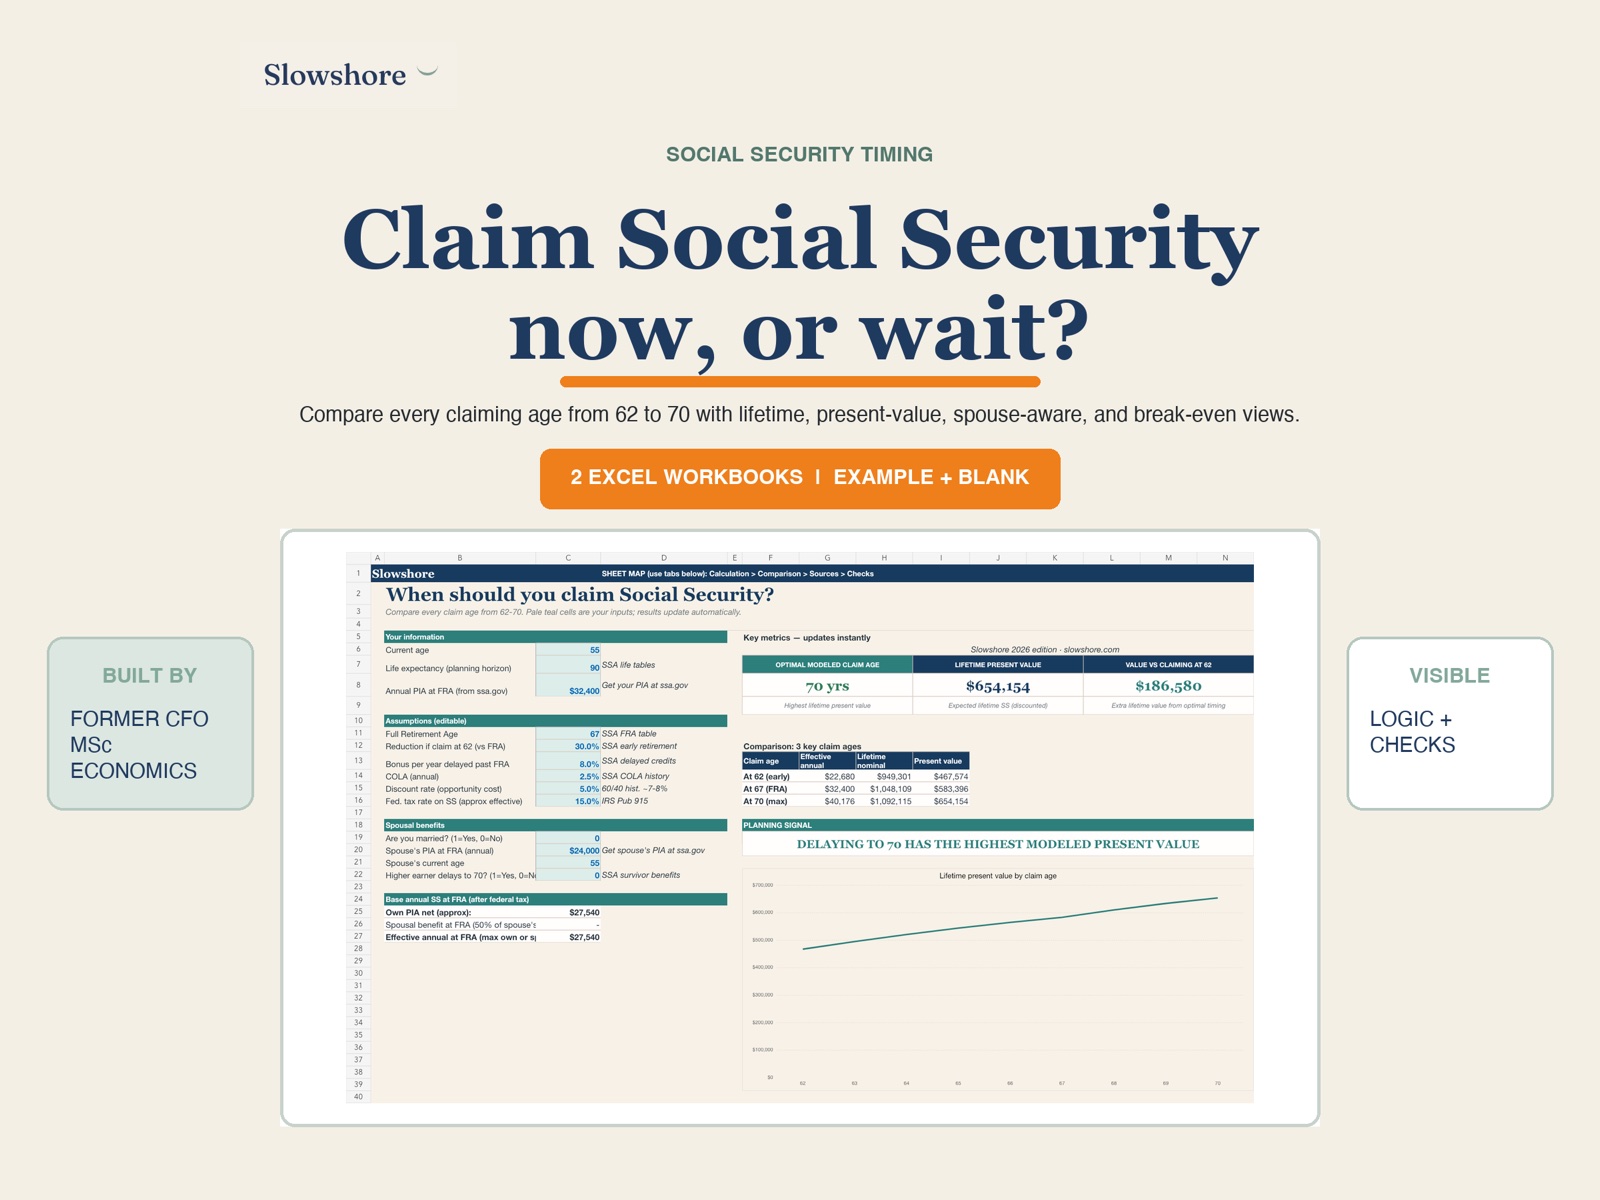
Ages 62 through 70 modeled with the actual delayed retirement credits and early-claim reductions.
Social Security Claiming Optimizer 2026
Compare claiming at 62, at Full Retirement Age, and delaying to 70. See the age at which delaying pays for itself, both in today's dollars and in nominal amounts.
$9 · One-time purchase
 1 / 8
1 / 8 What you get
Ages 62 through 70 modeled with the actual delayed retirement credits and early-claim reductions.
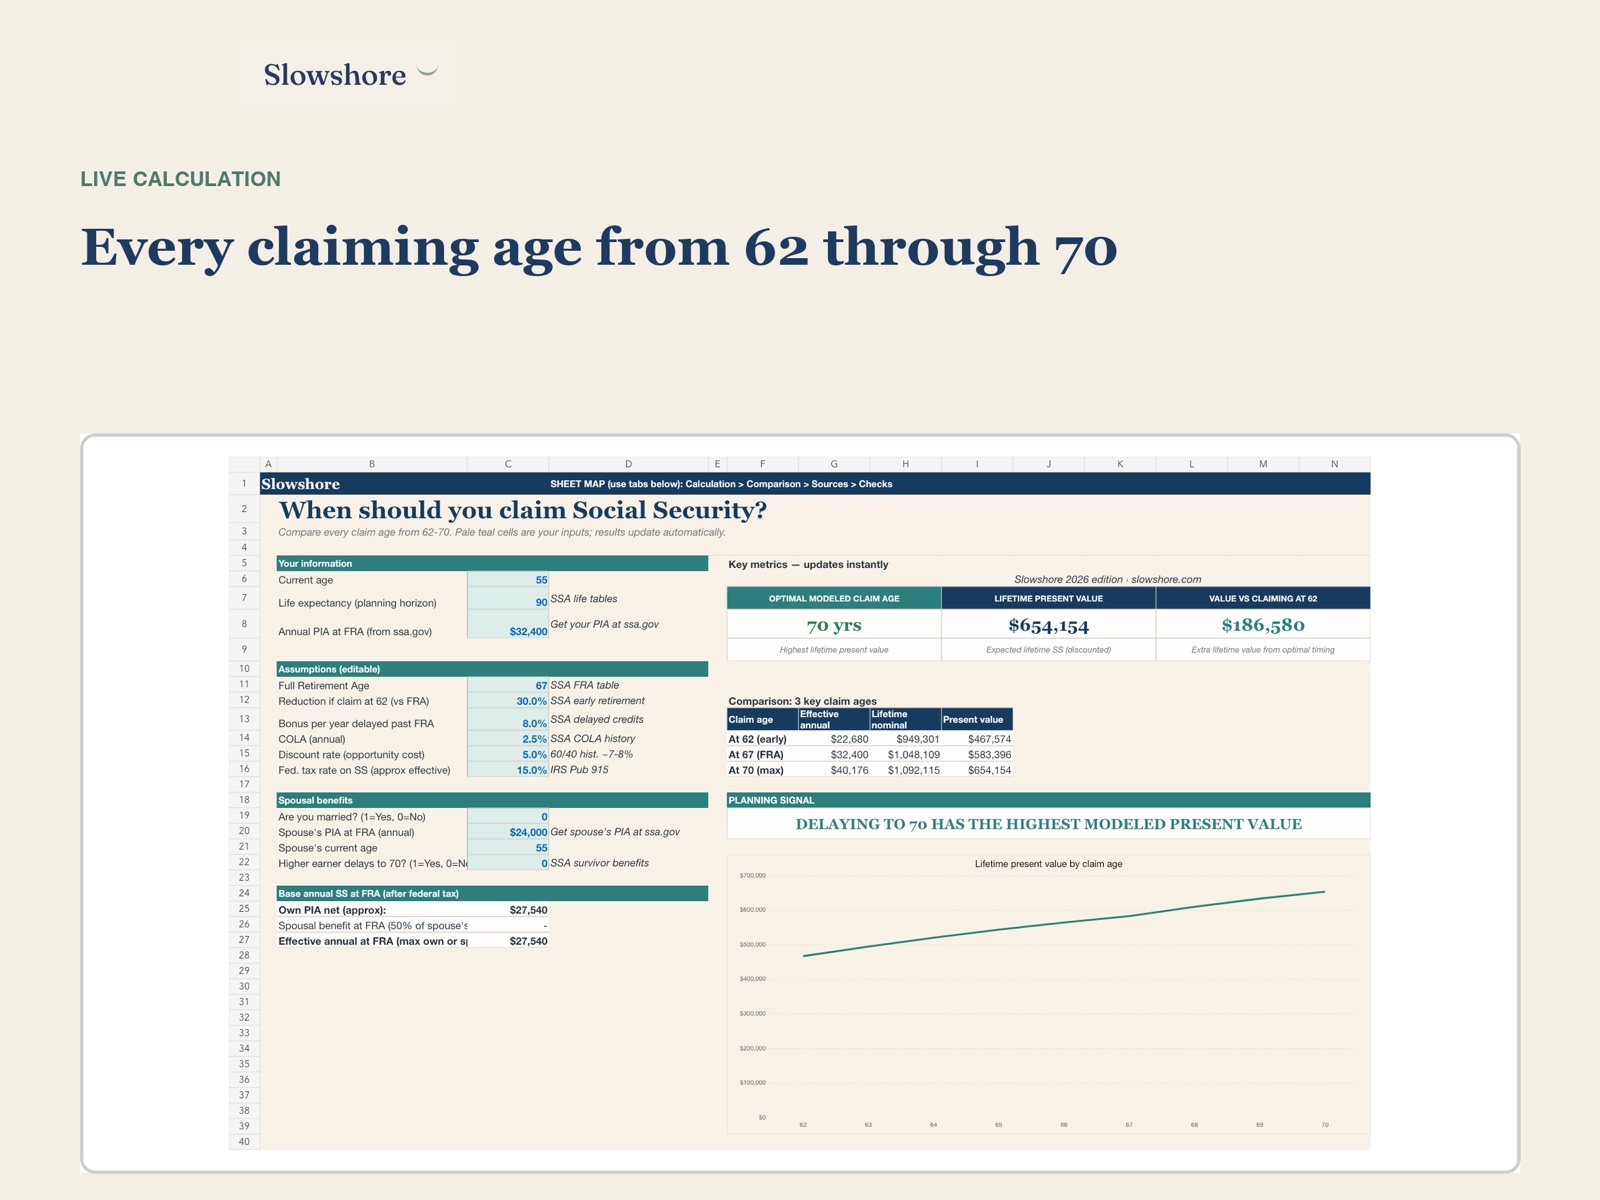
The age at which delaying has paid for itself. Calculated in today's dollars (discounted) and in nominal amounts.
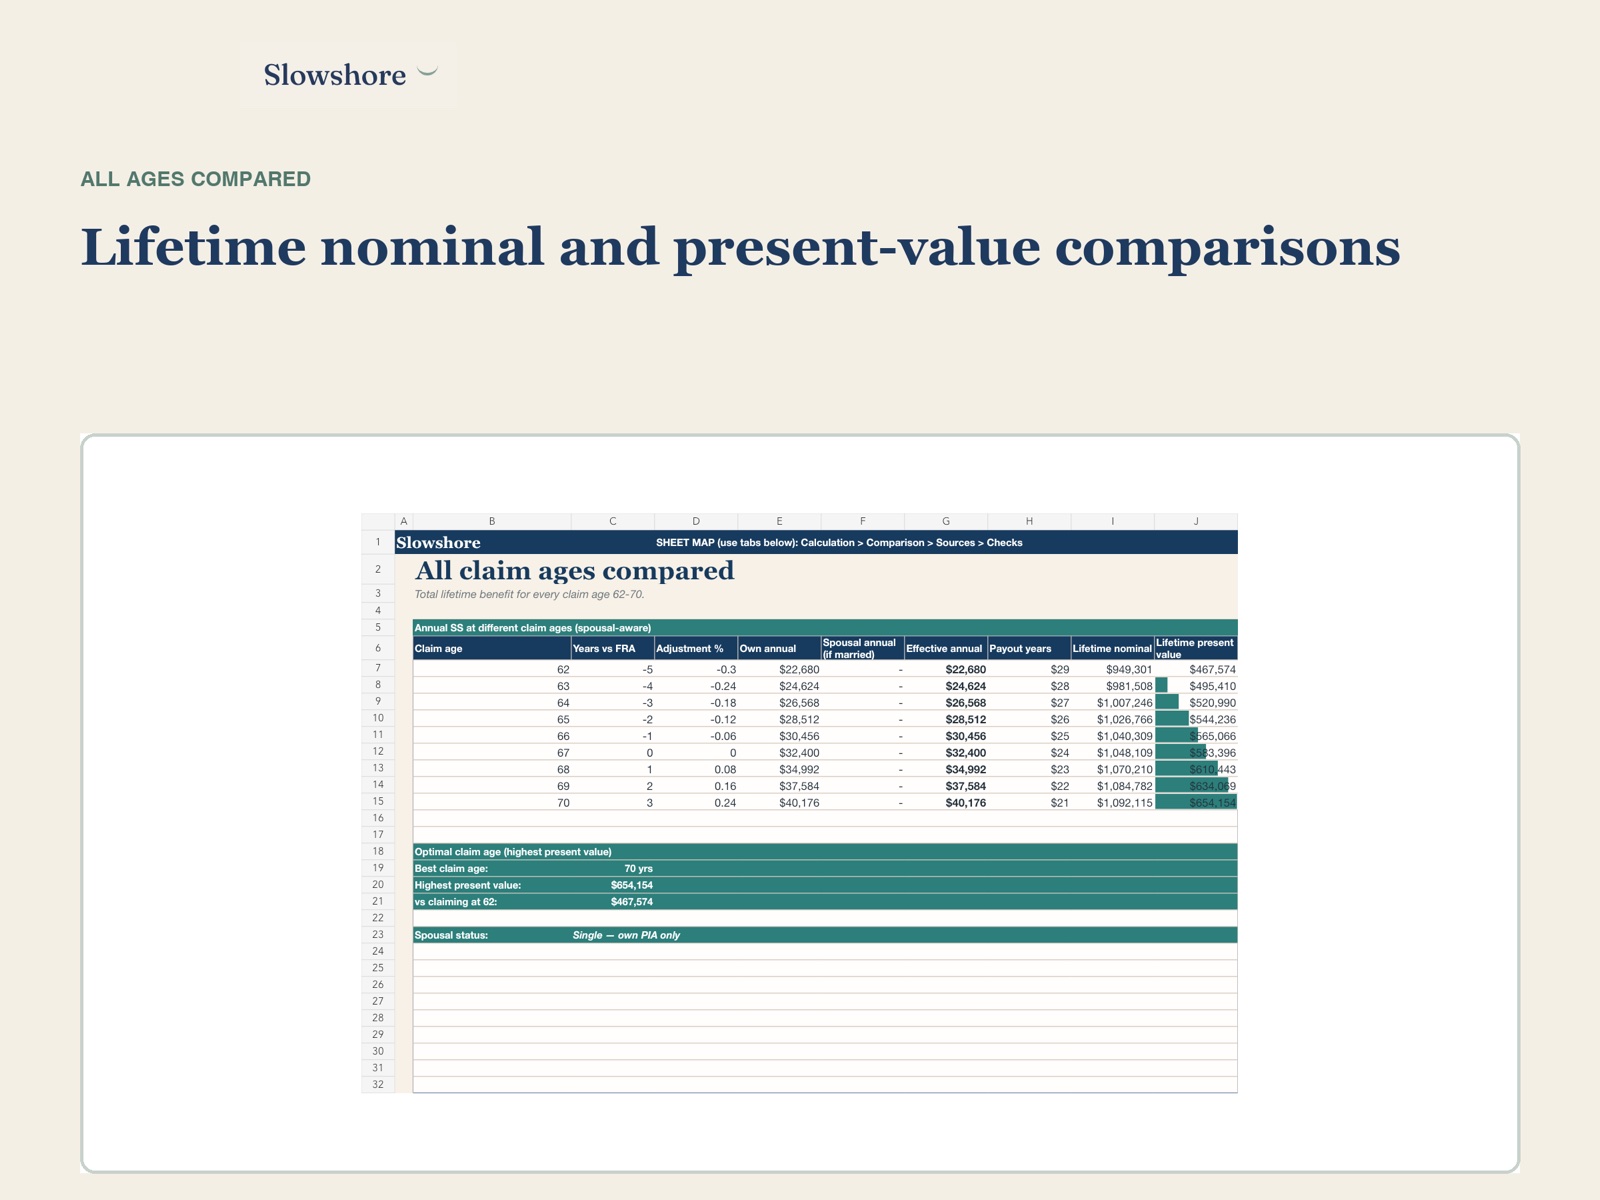
Every comparison shows present value and nominal side by side, so you can pick the perspective that fits your situation.
Detail
Comparison
One line per delay year. You see where the curves cross, and when a delay has paid for itself.
Present value
Choose the perspective that fits. Nominal numbers are easier to grasp, present value is economically correct.
Life expectancy
Adjust expected life expectancy directly in the Assumptions tab. The result updates instantly.
Trust and method
Created by Christian Elkrog, an economist and tech founder with more than a decade of experience and a successful company exit.
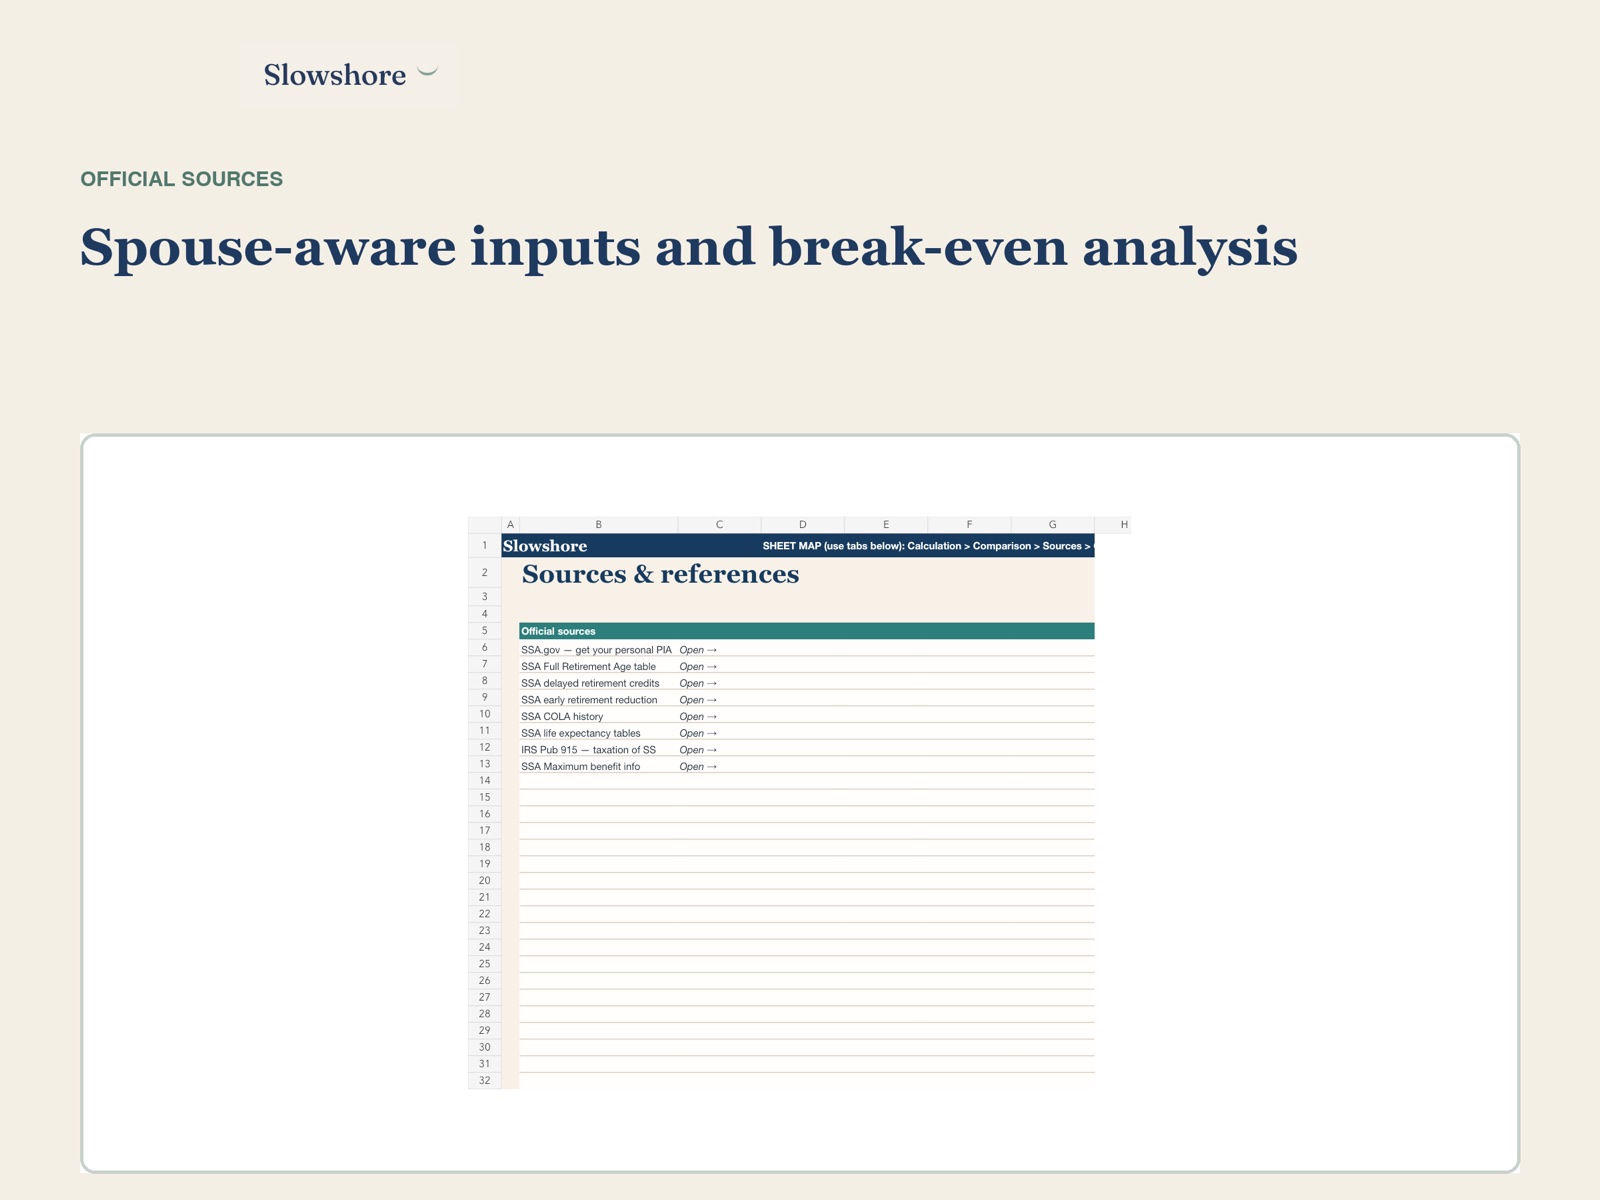
Inputs, assumptions, formulas, sources, and limitations are visible so you can understand each result.
No account connection or hidden data collection. Slowshore never receives the information you enter.
Sources
Social Security Administration benefit tables. SSA period life tables for life-expectancy assumptions. All sources linked in the spreadsheet.
Pricing
Start with this workbook for $9, or get all 8 for $59. One-time purchase with no subscription.
Looking for the browser version? Join the waitlist.
FAQ
No, you fill in marked cells and everything calculates automatically.
See the full list on the product page before buying. The basics: age, retirement account balances, expected spending.
Yes, plus Google Sheets. We send both versions after purchase.
The Excel version stays on your own computer. We never see your numbers.
No. It is a planning tool. Always consult a licensed advisor before major decisions.
14-day money-back guarantee, no questions asked.